In the world of transportation, where the thrill of the open road meets the quest for efficient travel, motorcycles stand as a symbol of freedom and agility. More than 8.6 registered motorcycles attest to their continued popularity as an economical mode of transportation. But, of course, any discussion about motorcycles eventually gets around to their lack of stability and ability to protect riders and passengers from serious injury in a crash.
The best way to better understand motorcycles and accidents that happen to people who ride them is by looking at motorcycle accident statistics. Accident statistics offer insight into the common causes of accidents and things you can do, such as wearing a motorcycle helmet to reduce the risk of a crash and minimize the severity of the injuries in case of one.
If you ride a motorcycle, the data presented here will be of interest. As you read through this analysis of recent motorcycle accident statistics, you will find information to become a better and safer rider.
Motorcycle Accidents Statistics
As you can see from the accompanying chart from the National Safety Council, the number of registered motorcycles in the United States and the miles traveled remained relatively stable over the past nine years.
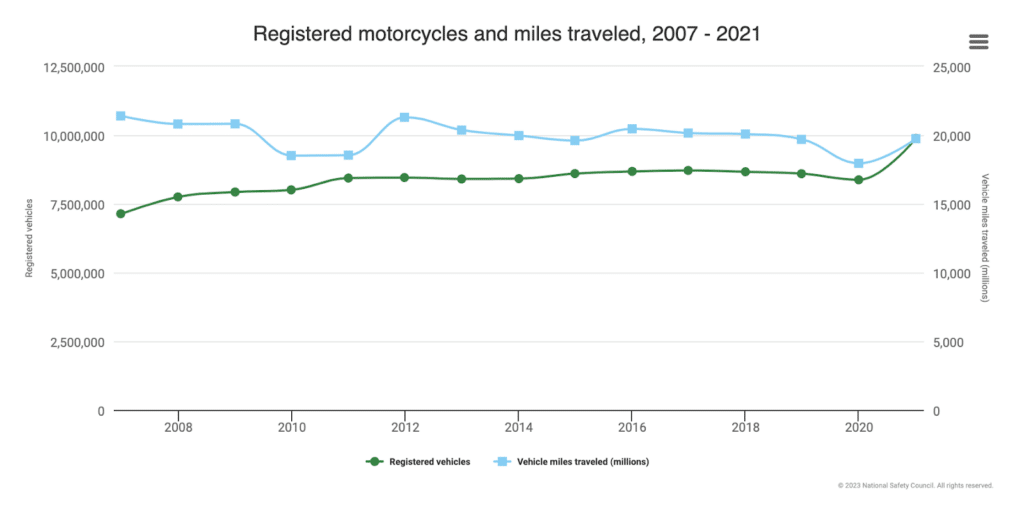
Source: National Safety Council
The stability of the two categories makes it easier to conclude an analysis of motorcycle accident statistics without having to take into account dramatic fluctuations in the number of vehicles or the miles ridden.
According to Statista, in 2021, the total number of public, personal, and commercial motorcycles registered in the US states and the District of Columbia totaled approximately 9.89 million. In the same year, New York and California reported the highest amount of registered private and commercial motorcycles in the country, with 969,825 and 812,924 units.
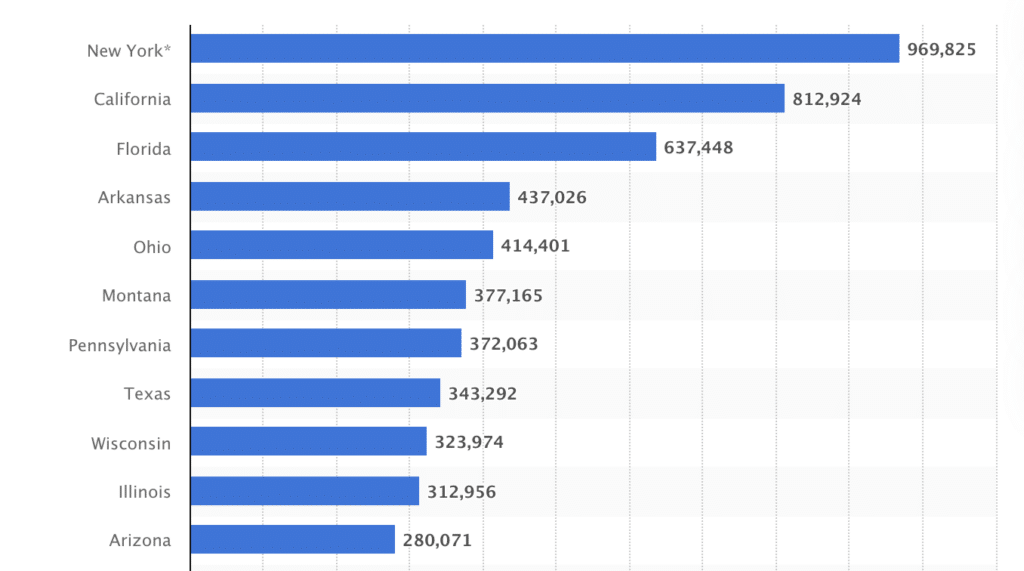
At the bottom of the ranking are Rhode Island, Delaware, the District of Columbia, and less populated states such as Wyoming and Alaska, with less than 25,000 registrations.
Motorcycle Accidents Per Year
The challenge faced when researching motorcycle accidents is the absence of data available for the number of accidents occurring throughout the country over a year. The failure to report a motorcycle accident to the police or state motor vehicle departments may be the reason for the lack of data. There are, however, reliable statistics available to give insight into how motorcyclists compare with other motorists.
The following statistics were provided by the National Highway Traffic Safety Administration (NHTSA) and updated in September 2021.
- 36% of motorcyclists involved in a fatal accident in 2021 were driving without a valid motorcycle license.
- In 2021, motorcyclists involved in a fatal accident had a higher rate of alcohol disability than drivers of all other car types (28% on motorcycles, 24% on cars, 20% on light trucks, and 3% for large trucks).
- 43% of motorcyclists who died in single-vehicle crashes in 2021 were alcohol-impaired.
- In 2021, motorcycle riders who lost their lives in traffic crashes during nighttime were discovered to be alcohol-impaired at a rate three times higher than those involved in daytime crashes (42% compared to 16%). In states without the Universal Helmet Act, 5% of motorcyclists killed in 2021 did not wear helmets (compared to 9% in states with the Universal Helmet Act).
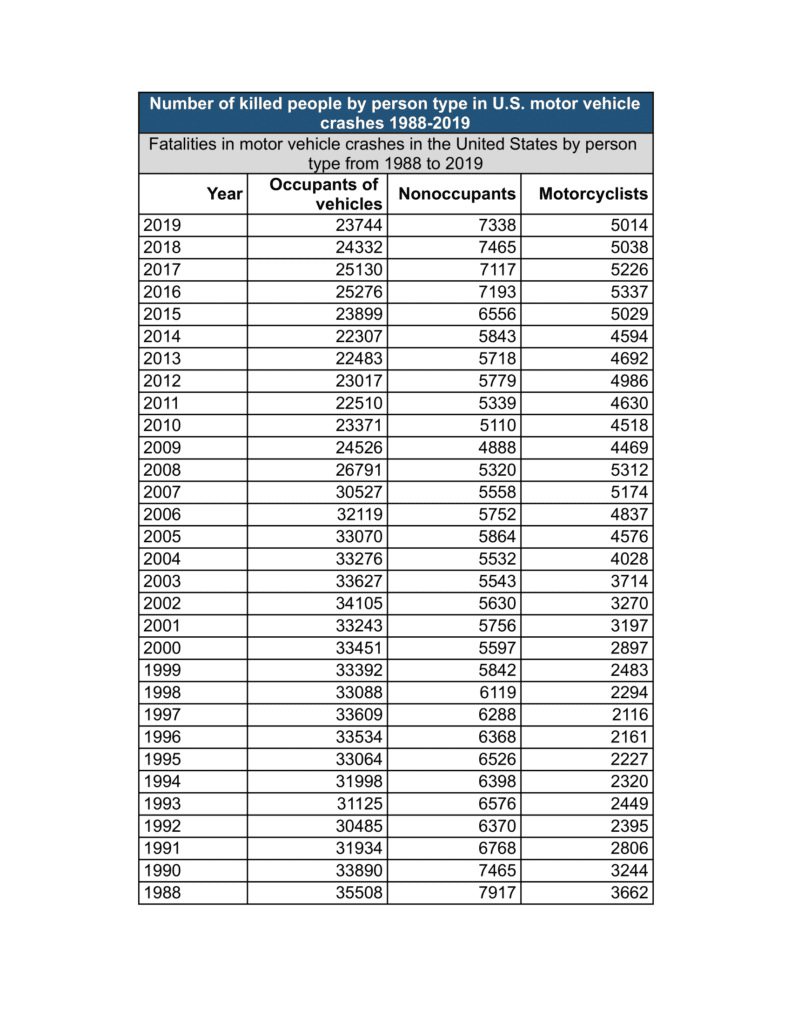
The table displayed below shows the number of killed people by person type in U.S. motorcycle accidents:
What Are the Odds of Crashing a Motorcycle?
Riding on two wheels rather than four makes motorcycles less stable than other vehicles, which makes the rider’s skill level important in being able to maintain control. Whatever the reason, you have a greater chance of crashing a motorcycle than driving in your car, truck, or SUV.
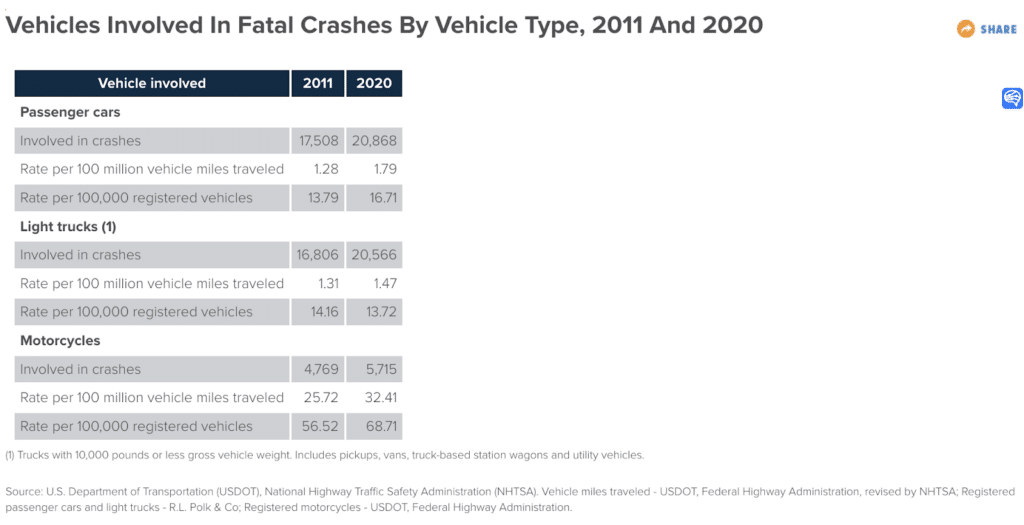
The chart below compares the rate of fatal collisions for different vehicles in 2011 and 2020, the most current year for which such data is available. As you can see from the chart, 32.41 fatal accidents involving a motorcycle occurred for each 100 million miles traveled in 2020, compared to only 1.79 collisions for passenger cars using the same number of miles.
The comparison of motorcycles to cars becomes even more striking when looking at the rate of fatal crashes per 100,000 registered vehicles. Motorcycles had a fatal crash rate of 68.71, while the rate for cars was 16.71.
Source: Insurance Information Institute
What Type of Motorcycle Has the Most Accidents?
Design, engine size, and equipment vary from one type of motorcycle to another, as does the rate of accidents. Some of the most popular types of motorcycles include:
- Cruisers
- Standards
- Sportbikes
- Super sports
Of all types of motorcycles registered in the U.S., one study found the fatal crash rate for super sports to be four times greater than any of the other types.
What State Has the Most Motorcycle Accidents?
New York and California rank as the top two states in terms of registered motorcycles, but the deadliest state is Texas, with a rate of fatal accidents of 13 per 10,000 registered motorcycles in 2021. Arkansas had a fatality rate of 12.8, and Missouri ranked third at 11.9.
Have You Been Involved In A Motorcycle Accident?
Our professional legal team screens submissions and assigns cases to some of the best motorcycle lawyers in the US.
Motorcycle Death Statistics
The opportunity to cruise along scenic highways without a steel cage obstructing your ability to see, hear, and experience your surroundings is one of the attractions of riding a motorcycle. It also represents why motorcycle riders are 29 times more likely to die in a crash, based on a comparison of vehicle miles driven, than drivers and passengers of other types of vehicles.
Analysis of available data about fatal motorcycle accidents provides a better understanding of the causes and factors contributing to the death of a rider instead of a survivable injury. This, in turn, can help save lives by developing new safety features and the increased use of currently available equipment, such as anti-lock brakes and helmets, that offer riders better control over their vehicles or provide increased protection when they crash.
What Percentage of Motorcycle Accidents Result in Death?
They may be fun and economical to ride, but the odds of surviving a motorcycle accident are against you. As previously cited, the NHTSA reports that you are 29 times more likely to be killed in a collision than occupants of other types of motor vehicles, and 5,014 riders died in crashes in 2021. This is the highest number of motorcyclists killed since FARS started data collection in 1975.
What Type of Motorcycle Accident Causes the Most Deaths per Year?
The accompanying chart shows that single-vehicle crashes in 2021, such as a motorcyclist losing control of the vehicle on a wet or snow-covered road, account for 38.82% of fatal accidents. The majority of fatal crashes, 53.25%, involved a motorcycle and one other vehicle. The remaining fatal crashes involved three or more vehicles.
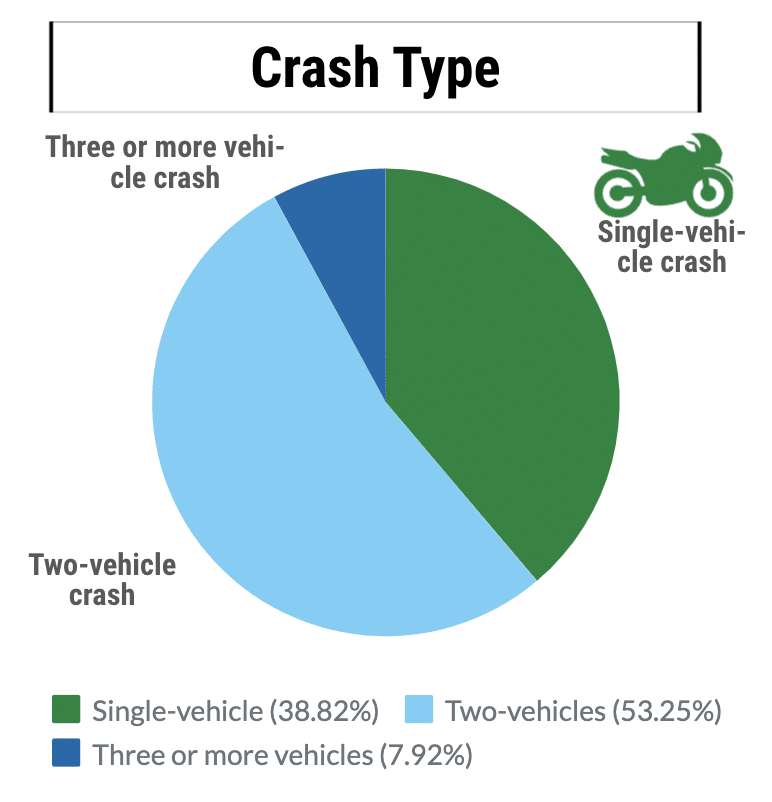
Source: National Safety Council
What State Has the Most Motorcycle Accident Deaths per Year?
Using crash data for 2021, the National Safety Council reports the following states as having the highest number of fatal motorcycle accidents:
- Florida (651)
- California (565)
- Texas (515)
- North Carolina (230)
- Ohio (223)
- Pennsylvania (222)
Weather that allows for year-round use of motorcycles may be a reason for the high fatality rate in Florida and the fact that cold-weather states, such as Alaska with six fatalities, do not have as many deaths due to motorcycle crashes.
Causes of Motorcycle Accidents Statistics
According to the NHTSA, in 2021, motorcycle accidents in the U.S. claimed the lives of 5,932014 riders and injured another 82,686. Not only were motorcyclists 29 times more likely to die in a crash than drivers and passengers of other types of vehicles, but they were four times more likely to be injured.
The smaller size relative to other vehicles makes it easier for a motorcycle not to be seen by other drivers. The lack of a protective cage and safety features, such as seat belts and airbags, that other vehicles have as standard equipment increases the likelihood that an accident will result in a motorcyclist being taken to a hospital.
The Most Common Causes of Motorcycle Accidents
The behavior of drivers and motorcyclists appears as the underlying cause of accidents, including:
- Alcohol and drug impairment.
- Distracted driving.
- Reckless driving.
- Speeding.
- Road rage.
- Poor or impaired visibility.
- Drowsy or sleepy.
- Improper lane use, including lane splitting.
The NHTSA reports that 43% of motorcyclists killed in single-vehicle crashes were impaired by alcohol, and 36% of riders did not have a valid motorcycle license.
Motorcycle vs. Car Accidents
The fact that car accidents occur more frequently than motorcycle accidents should not be a surprise considering that cars far outnumber motorcycles.
According to the U.S. Department of Transportation, these are some stats onof motorcycle vs. car accidents:
Motorcycle Accidents
- You are about 30 times more likely to die in a motorcycle accident than in a car accident.
- Motorcycle accidents show an astonishing 80% injury or mortality rate, while car accidents are around 20%.
- Motorcyclists over the age of 40 are injured in accidents about 20 times more often than drivers of the same age. Motorcycles make up only 3% of all registered vehicles, but more than 5% of highway deaths.
Car Accidents
- The average driver experiences vehicle-related accidents every six years, with near misses up to twice a month.
- According to statistics, more than 2 million people are injured in car accidents each year.
- The National Safety Council estimates that more than 12 million vehicle accidents occur each year in the United States, involving more than 20 million vehicles.
- According to a survey by the Ministry of Land, Infrastructure, Transport, and Tourism, about 6% of vehicle occupants suffer serious injuries or deaths.
Motorcycle vs. Truck Accidents
The chart below shows how motorcycles compare to trucks and cars regarding the involvement rate in fatal crashes. Less than 1% of trucks were involved in fatal crashes compared with 25% of motorcycles based on the rate per mile traveled. Trucks also did better based on the rate per 100,000 registered vehicles at 6.8% versus 58% motorcycles.
The table below shows Occupant Fatality Rates by vehicle type, 2011 and 2020:
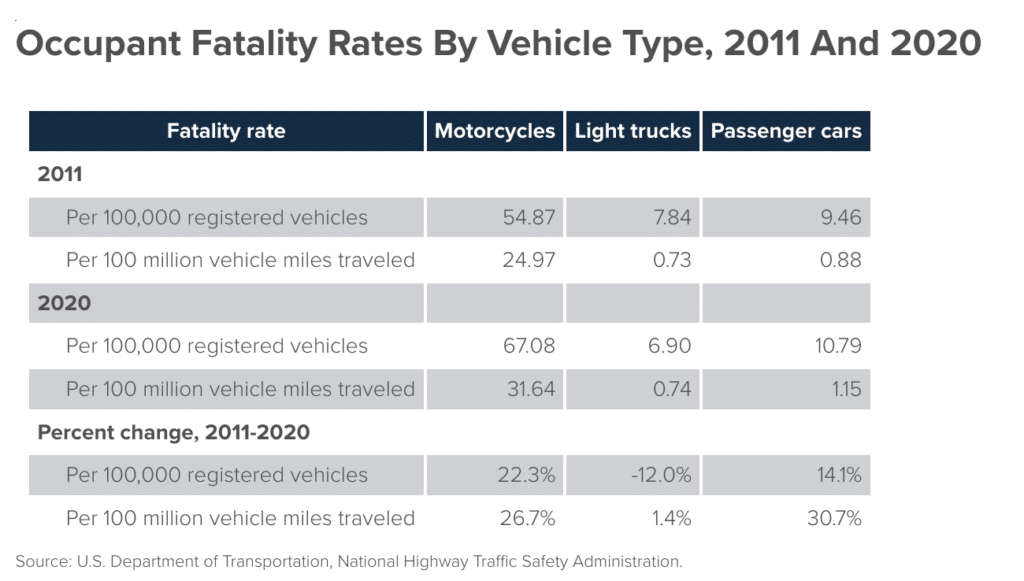
Source: U.S. Department of Transportation, National Highway Traffic Safety Administration.
Motorcycle Accident Injury Statistics
The statistics presented so far highlight the dangers and risks confronting motorcyclists, particularly fatalities. Whether taken from the perspective of vehicle miles traveled or the relative number of registered vehicles, motorcyclists have a much lower survival rate than occupants of other types of vehicles.
Motorcyclists do not fare much better when you look at the data for injury rates. The likelihood of a rider suffering an injury in a crash is four times greater than a driver or passenger riding in a car or truck.
Motorcyclist Injuries and Injury Rates by Year
The table presented shows injuries and injury rates for motorcyclists over the nine years from 2010 through 2019. It is the most currently available data derived from the NHTSA.
The 84,000 motorcyclists injured in crashes in 2019 increased by 2% from the previous year when 2,000 fewer injured riders were injured. This is notable because the number of registered motorcycles in the U.S. declined by 63,427, but the injury rate per 100,000 registered motorcycles increased slightly more than 3% over 2018.
Motorcycle Injuries by Type
An extensive study of accidents and injuries caused to riders found that some of the common injuries suffered by motorcyclists and the frequency of occurrence to be the following:
- Lower extremity injuries occurred in 47% of collisions.
- Upper extremity injuries occurred in 40% of collisions.
- Head injuries occurred in 35% of collisions.
- Chest injuries occurred in 31% of collisions.
- Spine injuries occurred in 20% of collisions.
- Abdomen injuries occurred in 15% of collisions.
- Face injuries occurred in 10% of collisions.
A person on a motorcycle who crashes into another vehicle or stationary roadside object at highway speeds will most likely suffer severe and extensive injuries over several body parts.
Factors That Have The Most Impact On Motorcycle Accidents
Data collected about motorcycle crashes point toward the four factors, geographic, time of day, weather, and intoxicated driving, displayed in the accompanying charts as impacting motorcycle accidents.
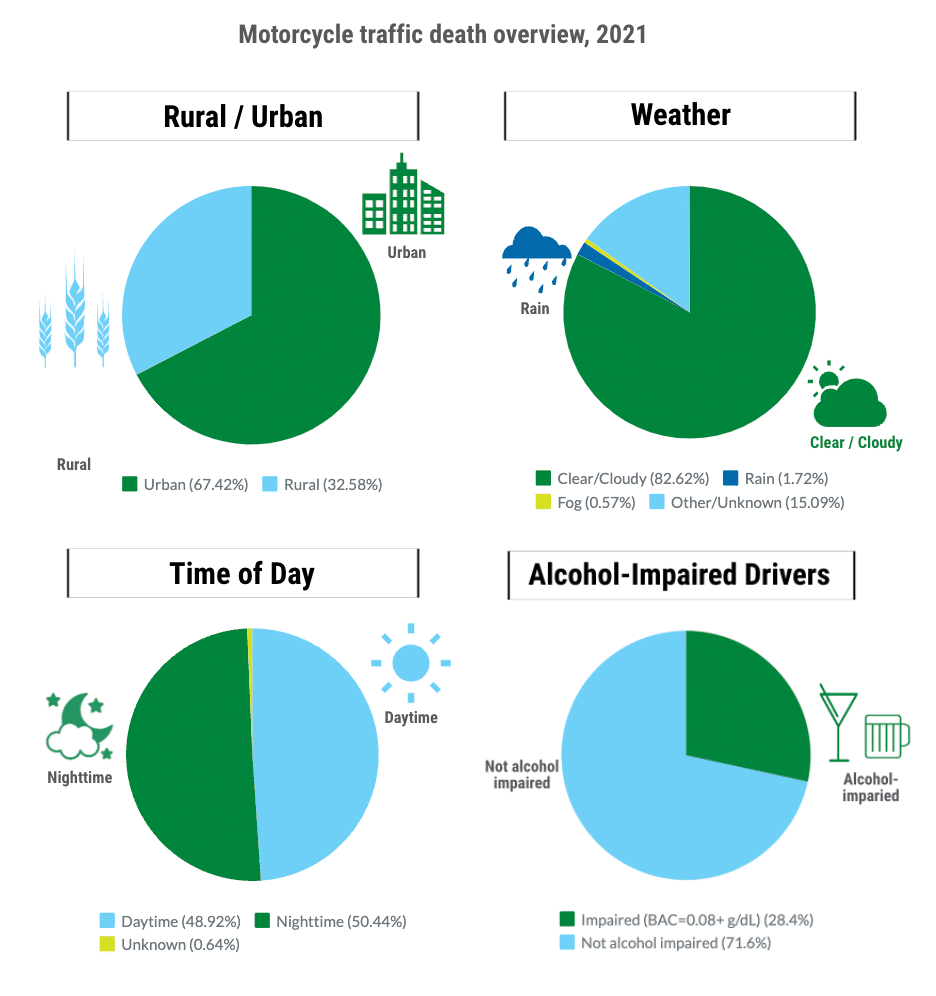
Source: National Safety Council
Geographic
If you live in a city or other urban area, you have a greater risk of being involved in an accident than you would if living in a rural area. For example, 67% of fatal motorcycle crashes occurred in urban settings and slightly under 33% in rural areas.
Time of day
Most fatal accidents occur between noon and 9 p.m. during the week. However, the most dangerous weekend hours for motorcycle riders are between noon and midnight. The rate at which they occur seems to be split almost equally between daytime and nighttime hours.
Weather
If you were asked to guess the weather conditions that prove most dangerous for motorcycle riders and guessed rain or snow, you are wrong. Just about 82% of fatal motorcycle accidents occur when the skies are clear or cloudy. Only about 1.72% of accidents can be attributed to roads or visibility affected by rain. Fog, which you might have imagined obscuring visibility and increasing the risk of crashing, was a factor in less than 0.57% of fatal accidents.
Intoxicated Driving
Of the fatal motorcycle accidents occurring in 2021, the NHTSA found that 28.4% of motorcycle operators were intoxicated. It also found that the 35-39 and 45-to-49 age groups had the highest percentage (35%) of drunk motorcycle riders killed during that year.
Motorcycle Helmet Use Statistics
Motorcycle helmets save lives and reduce the severity of injuries to riders and passengers. Estimates show helmets to be 37% effective in preventing rider fatalities and 41% effective in preventing passenger deaths.
Motorcycle Helmet Use by Year
This chart from the NHTSA shows the percentage of motorcyclists using a DOT-approved helmet. It covers the years from 2011 through 2020.
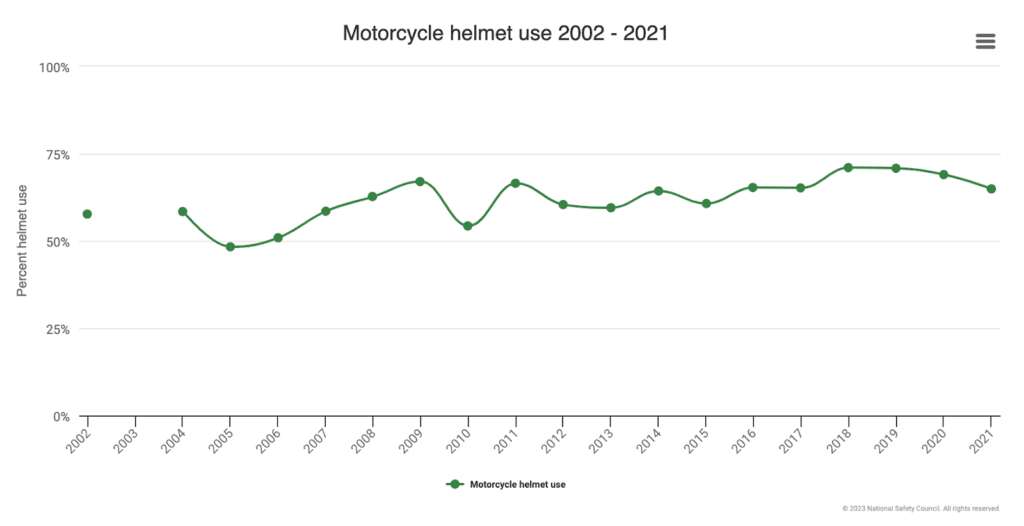
Source: Motorcycle Helmets – Injury Facts
Lives Saved From Motorcycle Helmet Use
Government estimates show that more than 25,000 lives have been saved since 2002 through helmets by motorcyclists. This chart from the National Safety Council shows you the percentage of riders wearing helmets and the lives saved in any year from 2002 through 2019.
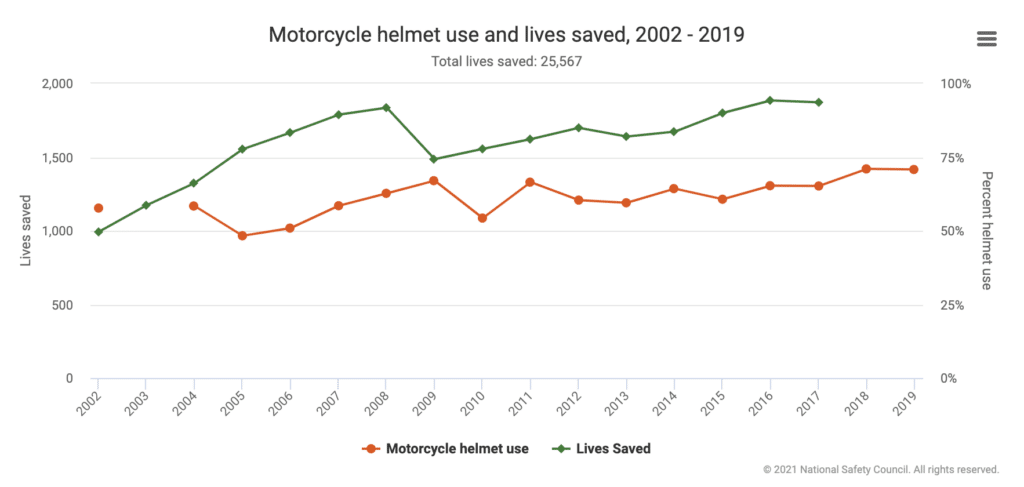
National Safety Commission 2021
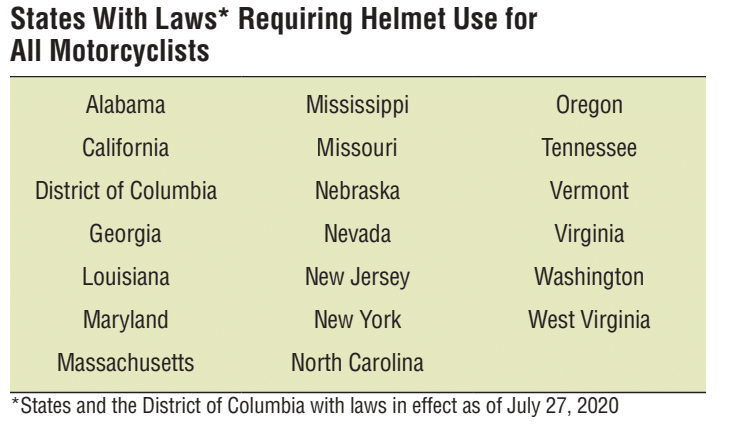
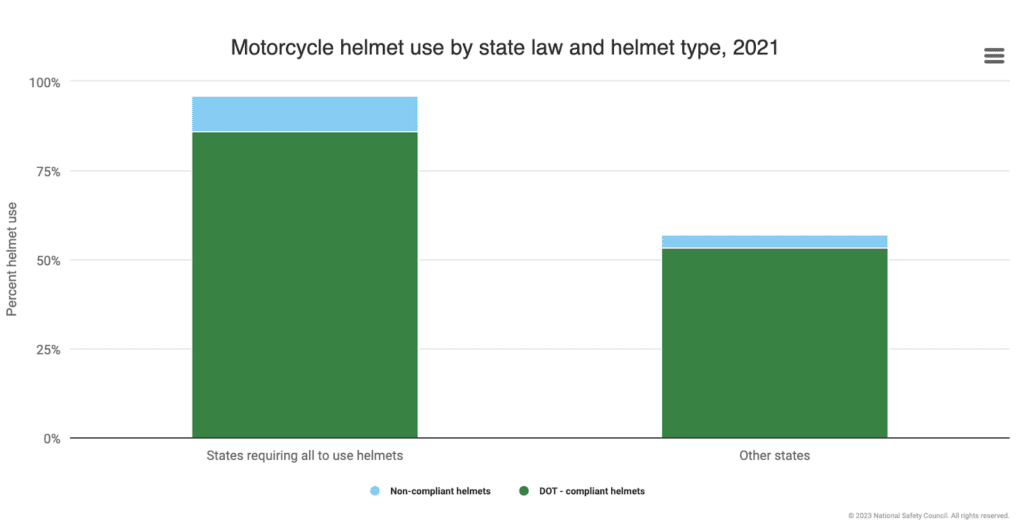
Motorcycle Helmet Use by State Law and Helmet Type
Currently, 19 states and the District of Columbia have universal helmet laws requiring their use by all motorcyclists. Three states have no laws on helmet use, and the remaining states have laws requiring helmets, requiring them only for some riders, such as those under 21 years of age. The chart from the NHTSA compares helmet usage by type of helmet and the percentage of riders wearing them in states with and without universal helmet laws.
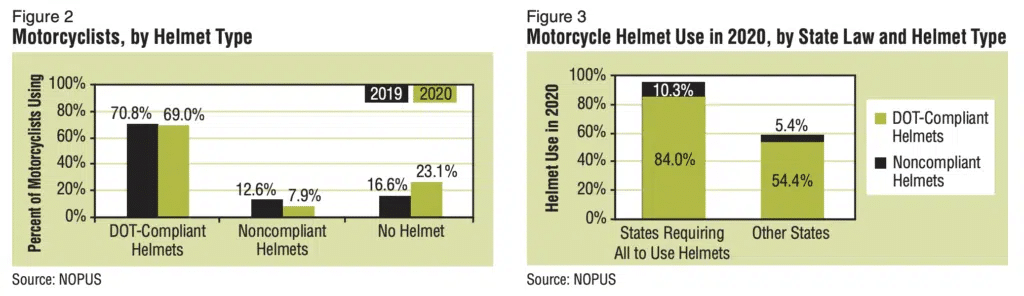
Source: National Highway Traffic Safety Commission
Source: National Highway Traffic Safety Commission
Tips for Motorcycle Safety
Now that you have all of the statistics about the dangers of riding a motorcycle, here are five tips that may help ensure that you arrive at your destination safe and unharmed:
- Awareness always: Some people may prefer to call it defensive riding. Still, you need to be alert to situations that may endanger your safety. Leaving sufficient space between your motorcycle and the vehicle ahead of you and staying out of other blind spots are only a few examples of always being aware and alert.
- Make yourself visible: Wear bright clothing during the day and clothing made with reflective material at night to make you more visible to other motorists. Reflective tape applied to your helmet increases visibility. Being visible includes staying out of blind spots.
- Wear appropriate safety gear: Regardless of the laws in your state, wear a DOT-approved motorcycle helmet that fits you properly and have it securely fastened at all times. Safety glasses or a face shield attached to your helmet protect your eyes. Long sleeves, pants, and gloves protect you from injury should you be knocked off your bike.
- Ride a motorcycle that suits you: A too big, too heavy, or overpowered motorcycle is difficult to control and increases the risk of an accident. Buy a motorcycle that you can control, particularly when you need to maneuver out of a dangerous situation.
- Anticipate conditions: It may be a clear, sunny day when you start your ride, but weather conditions can quickly change and result in you riding in rain or snow. After checking the weather forecast before heading out, make sure you also look at the route you plan to take and the address of your destination.
- When prioritizing motorcycle safety, remember that preparedness goes beyond gear and cautious riding. It’s crucial to be informed about reliable accident lawyers as well. In case of unfortunate incidents, having a skilled legal representative can make a substantial difference in navigating the complexities of the aftermath. So, alongside helmets and defensive riding, ensure you’re also prepared with a trustworthy accident lawyer who understands the unique challenges motorcyclists might face on the road.
Keep in mind that most of the common causes of motorcycle accidents are related to the behavior of the motorist and motorcycle rider. Therefore, making yourself a better rider will make you a safer one as well.
Conclusion
This is a call to action for all of us who love hitting the open road on two wheels. The numbers tell a story of vulnerability, where riders bear a greater risk burden than those in cars. It’s a wake-up call to pay attention, to take care, and to make smart choices.
When we dig into the data, we see patterns that can’t be ignored: the dangers of impaired driving, the distractions that divert our attention, the temptation to speed, and the need to be seen on the road. And let’s not forget the lifesavers—helmets.
So, as you delve into these numbers, remember they’re not just digits; they’re insights that can save lives. Let’s be the riders who know better, ride smarter, and make each journey a chance to stay safe and savor the freedom of the open road.